By Phil La Greca

Welcome to our latest review of the super industry, designed to monitor trends and highlight points of interest.
The superannuation industry is now valued at $2.199 trillion according to the latest figures from regulator APRA.
To put that into context, Australia’s GDP for 2016 was $1.410 trillion dollars and the total market capitalisation of all the companies in the ASX 200 is $1.668 trillion.
The table below shows the total amount held in superannuation since December 2015 ($b), broken down by sector.
| Sector | Dec 2015 | Mar 2016 | Jun 2016 | Sep 2016 | Dec 2016 |
| Corporate | 54.1 | 53.7 | 54.7 | 56.3 | 57.6 |
| Industry | 445.6 | 446.5 | 466.4 | 481.7 | 500.6 |
| Public sector | 214.8 | 215.7 | 223.9 | 231.8 | 237.5 |
| Retail | 540.5 | 531.7 | 545.3 | 558.6 | 569.7 |
| SMSFs | 603.8 | 600.6 | 619.8 | 639.4 | 653.8 |
| Other | 187.6 | 185.8 | 188.5 | 178.1 | 179.3 |
| Total | 2,046.4 | 2,034.0 | 2,098.0 | 2,145.9 | 2,198.5 |
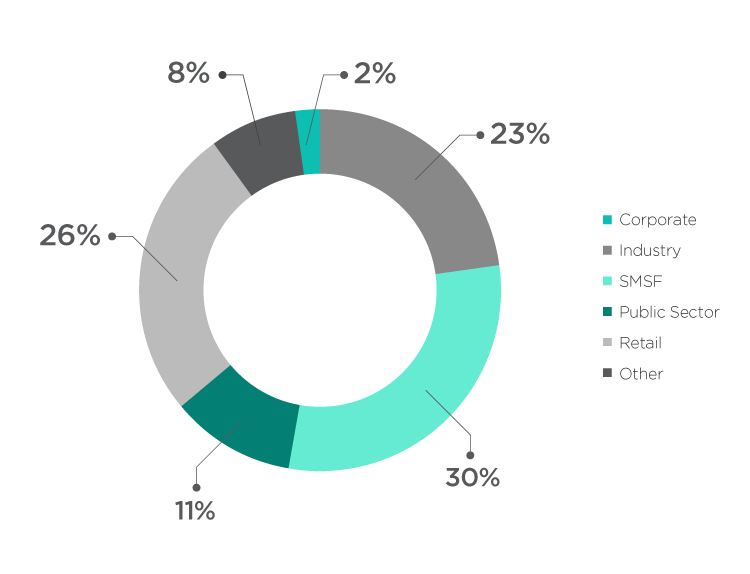
Looking at the various sectors comprising the total superannuation pool, the percentage breakdown is as follows, based on December ’16 APRA figures.

When we look at the net rollovers for the December 2016 quarter, we see the following pattern.
| Corporate super | negative $531 million |
| Industry super | positive $276 million |
| Public sector | negative $663 million |
| Retail super | negative $577 million |
| SMSFs | positive $1.596 billion |
This continues the trend where net rollovers to SMSFs for the 2015 calendar year totalled $7.169 billion and for the 2016 year totalled $6.773 billion.
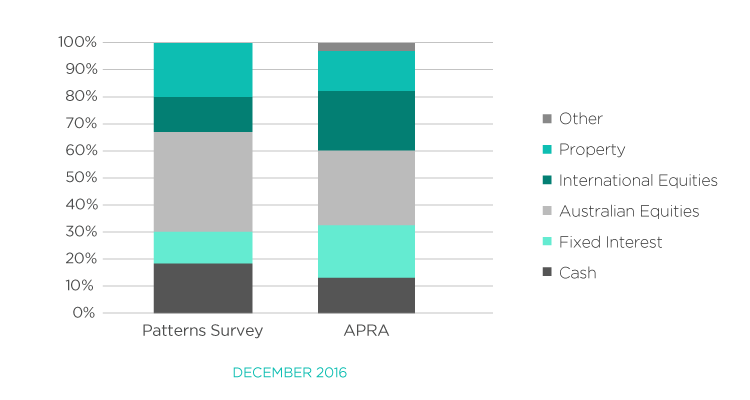
The other area of interest is asset allocation. When we compare the APRA’s figures with the SMSFs in our Investment Patterns Survey, some interesting trends come to view.

While SMSFs hold more cash, the aggregate cash and fixed interest allocation for both sectors is similar: 30.8% for SMSFs in our survey and 32.5% according to APRA.
The aggregate equities exposure is also close with our survey and APRA returning figures of 49.1% and 50.2% respectively.
In terms of other defensive assets (property and infrastructure), the difference is more significant but this can be explained due to harder accessibility to infrastructure for SMSFs.