By Philip La Greca

We regularly review the SMSF sector from a statistical viewpoint, in order to monitor trends and to highlight points of interest.
This article, at the time of writing, is based on the latest available ATO data: a report released in December 2016 based on 2014/15 SMSF tax returns. The time lag is a function of the tax return process.
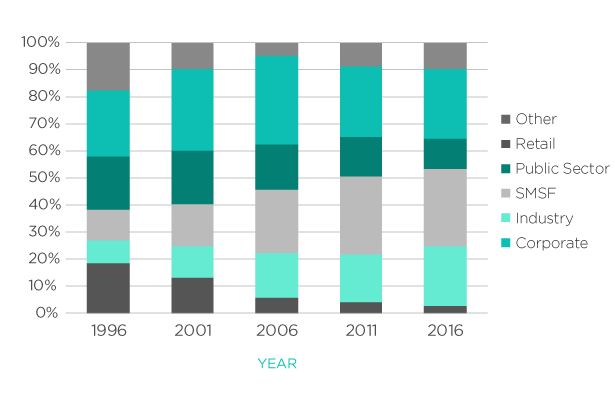
The SMSF sector remained the largest sector of the Australian superannuation industry, with 29% of the $2.1 trillion total super assets as at 30 June 2015. Over the last five years however, SMSFs are no longer the fastest growing sector of the Australian superannuation industry. During this period total super assets grew by 59%, while SMSF assets grew by 55%. This largely due to the decline in net cash flow of contributions vs benefits which has fallen from $16 billion in 2011 to $7.8 billion in 2015.

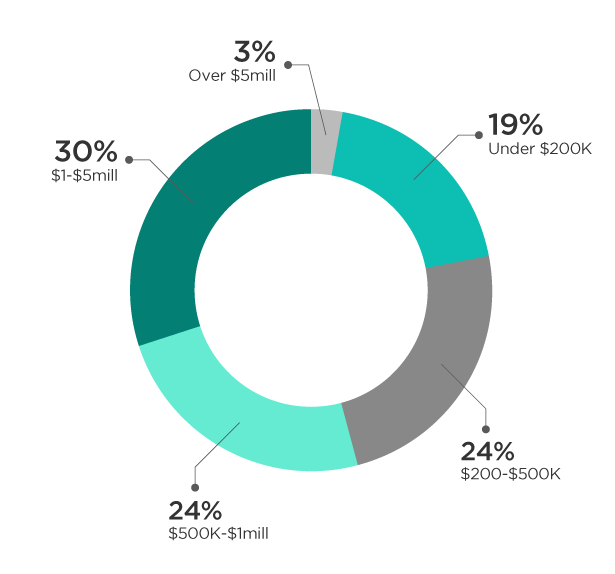
The mean average per SMSF is $1,111,732 at 30 June 2015. The number of SMSFs with more than $1 million of assets has grown from 27.5% in 2011 to 33.0% in 2015. Conversely the number of SMSFs under $200,000 has fallen from 24.7% in 2011 to 19.1% in 2015.

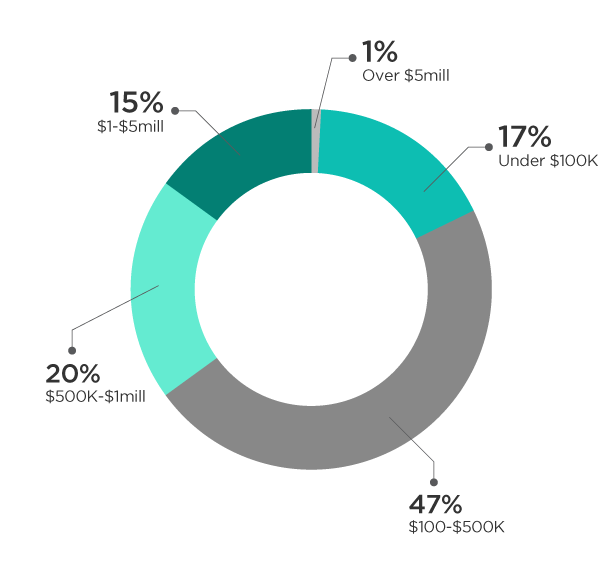
The average member balance was $589,636. This compares with the average non-SMSF member balance of $46,000. Most members (47.5%) have balances between $100k and $500k. Almost 16.9% of members have balances below $100k, while 15.9% of members have balances in excess of $1 million.
It was also reported that 38% of SMSF members still had entitlements in other superannuation funds presumably to maintain insurance.

70.7% of SMSF members were over 50 years of age. This contrasts with non-SMSFs where 71% of members are under age 50.
However, there are signs of increasing SMSF uptake amongst a younger age band. The 2015 year shows members below age 35 representing slightly over 10% of the newly established funds, compared to 5.7% for the whole SMSF member population.
Over the five-year period to 30 June 2015, contributions to the SMSF sector averaged $26.6 billion a year (member contributions $20.0 billion, employer contributions $6.6 billion). Member contributions to SMSFs increased by 54% over this period, while employer contributions decreased by 0.5%. By comparison, both member and employer contributions to all super funds increased by approximately 48% and 24% respectively. This discrepancy is driven by the age differences between SMSFs and other super funds – with non-SMSFs having fewer retired members and thus receiving more compulsory employer contributions.
| 2011 | 2012 | 2013 | 2014 | 2015 | |
| Contributions ($b) | 23.8 | 26.6 | 23.5 | 25.9 | 32.8 |
| Rollovers ($b) | 11.4 | 12.2 | 12.2 | 10.2 | 10.0 |
94% of all benefit payments now are pension payments, a significant increase from 74% in 2011.
More interesting is the proportion of benefits relating to transition to retirement pensions: 19% in SMSFs compared to 12% for superannuation overall.
Despite the higher average age demographics of SMSFs, only 48% were paying pensions to at least one member, while 52% of SMSFs reported they were solely in the accumulation phase.