By Phil La Greca

We regularly review the SMSF sector to monitor trends and highlight points of interest. This article is based on the latest available ATO data: a report released in January 2017 based on SMSF tax returns for FY 2016.
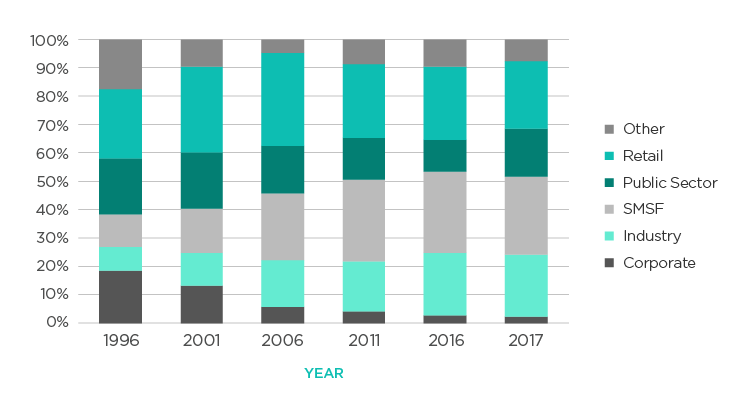
The SMSF sector remained the largest sector of the Australian superannuation industry, representing 29% of the total super pool (valued at $2.3 trillion as at 30 June 2017).
Over the last five years however, SMSFs are no longer the fastest growing sector. During this period total super assets grew by 68%, while SMSF assets grew by 65%. This largely due to the decline in net cash flow of contributions vs benefits which has fallen from $16 billion in 2011 to $4.2 billion in 2016.

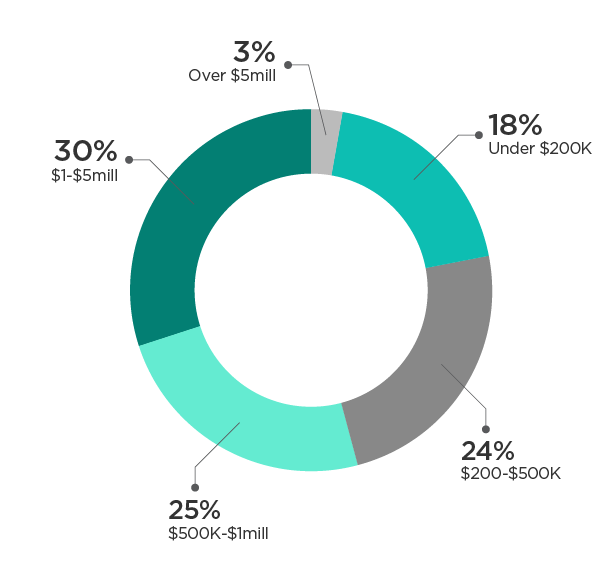
The average fund balance is approx. $1.1m at 30 June 2016 compared with a median of $641,983. The number of SMSFs with more than $1 million of assets has grown from 27.5% in 2011 to 37.8% in 2016. Conversely the number of SMSFs under $200,000 has fallen from 24.7% in 2011 to 17.9% in 2016.

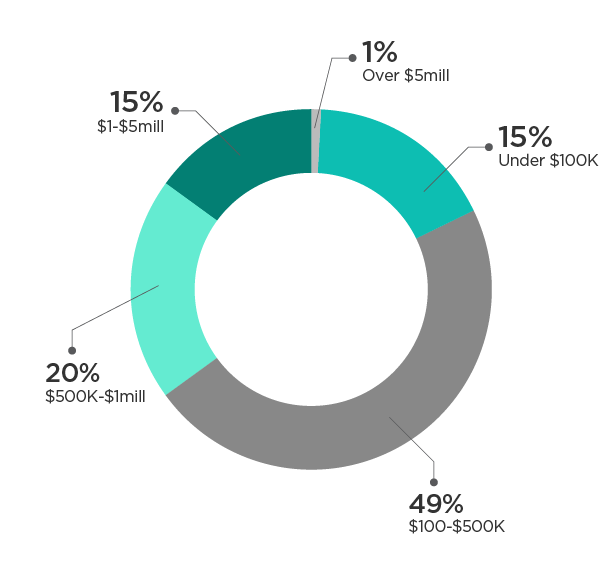
The average member balance was $599,265 compared with a median of $362,280. This compares with the average non-SMSF member balance of $46,000. Most members (47.5%) have balances between $100k and $500k. Almost 16.9% of members have balances below $100k, while 15.9% of members have balances in excess of $1 million.
It was also reported that 37% of SMSF members still had entitlements in other superannuation funds presumably to maintain insurance.

72% of SMSF members were over 50 years of age. This contrasts with non-SMSFs where 69% of members are under age 50. Although generally SMSF members are older, the trend continued with more members of new SMSFs to be from younger age groups. The 2016 year shows members below age 45 representing just over 42% of the newly established funds, compared to 16.9% for the whole SMSF member population.
Over the five-year period to 30 June 2016, contributions to the SMSF sector averaged $28.1 billion a year (member contributions $21.4 billion, employer contributions $6.6 billion). Member contributions to SMSFs increased by 31% over this period, with 83% of member contributions made by person over age 55 presumably including a significant proportion of re-contribution strategies.
| 2012 | 2013 | 2014 | 2015 | 2016 | |
| Contributions ($b) | 26.6 | 23.5 | 25.9 | 32.8 | 32.2 |
| Net rollovers ($b) | 12.2 | 12.2 | 10.2 | 10.0 | 9.7 |
| Benefits paid ($b) | 22.6 | 25.6 | 26.9 | 35.0 | 37.0 |
94% of all benefit payments now are pension payments, a significant increase from 82% in 2012. More interesting is that 19% relate to a transition-to-retirement pensions which is higher than the 12% for superannuation overall. Despite the higher average age demographics of SMSFs, only 47% were paying pensions to at least one member, while 53% of SMSFs reported they were solely in the accumulation phase. Nevertheless 44% of all superannuation pension payments are made by SMSFs.
For the year ending 30 June 2016, 14,800 contravention reports were lodged by 7,600 SMSFs. Just under half were reported as rectified at the time of reporting. The most commonly reported contraventions continued to be loans or financial assistance to members – 21.4% of all reports. 19% related to in-house assets and 12.8% to separation of assets.